KronoAnalyzer

Product Overview
- Intuitive and easy-to-use time-series data analysis
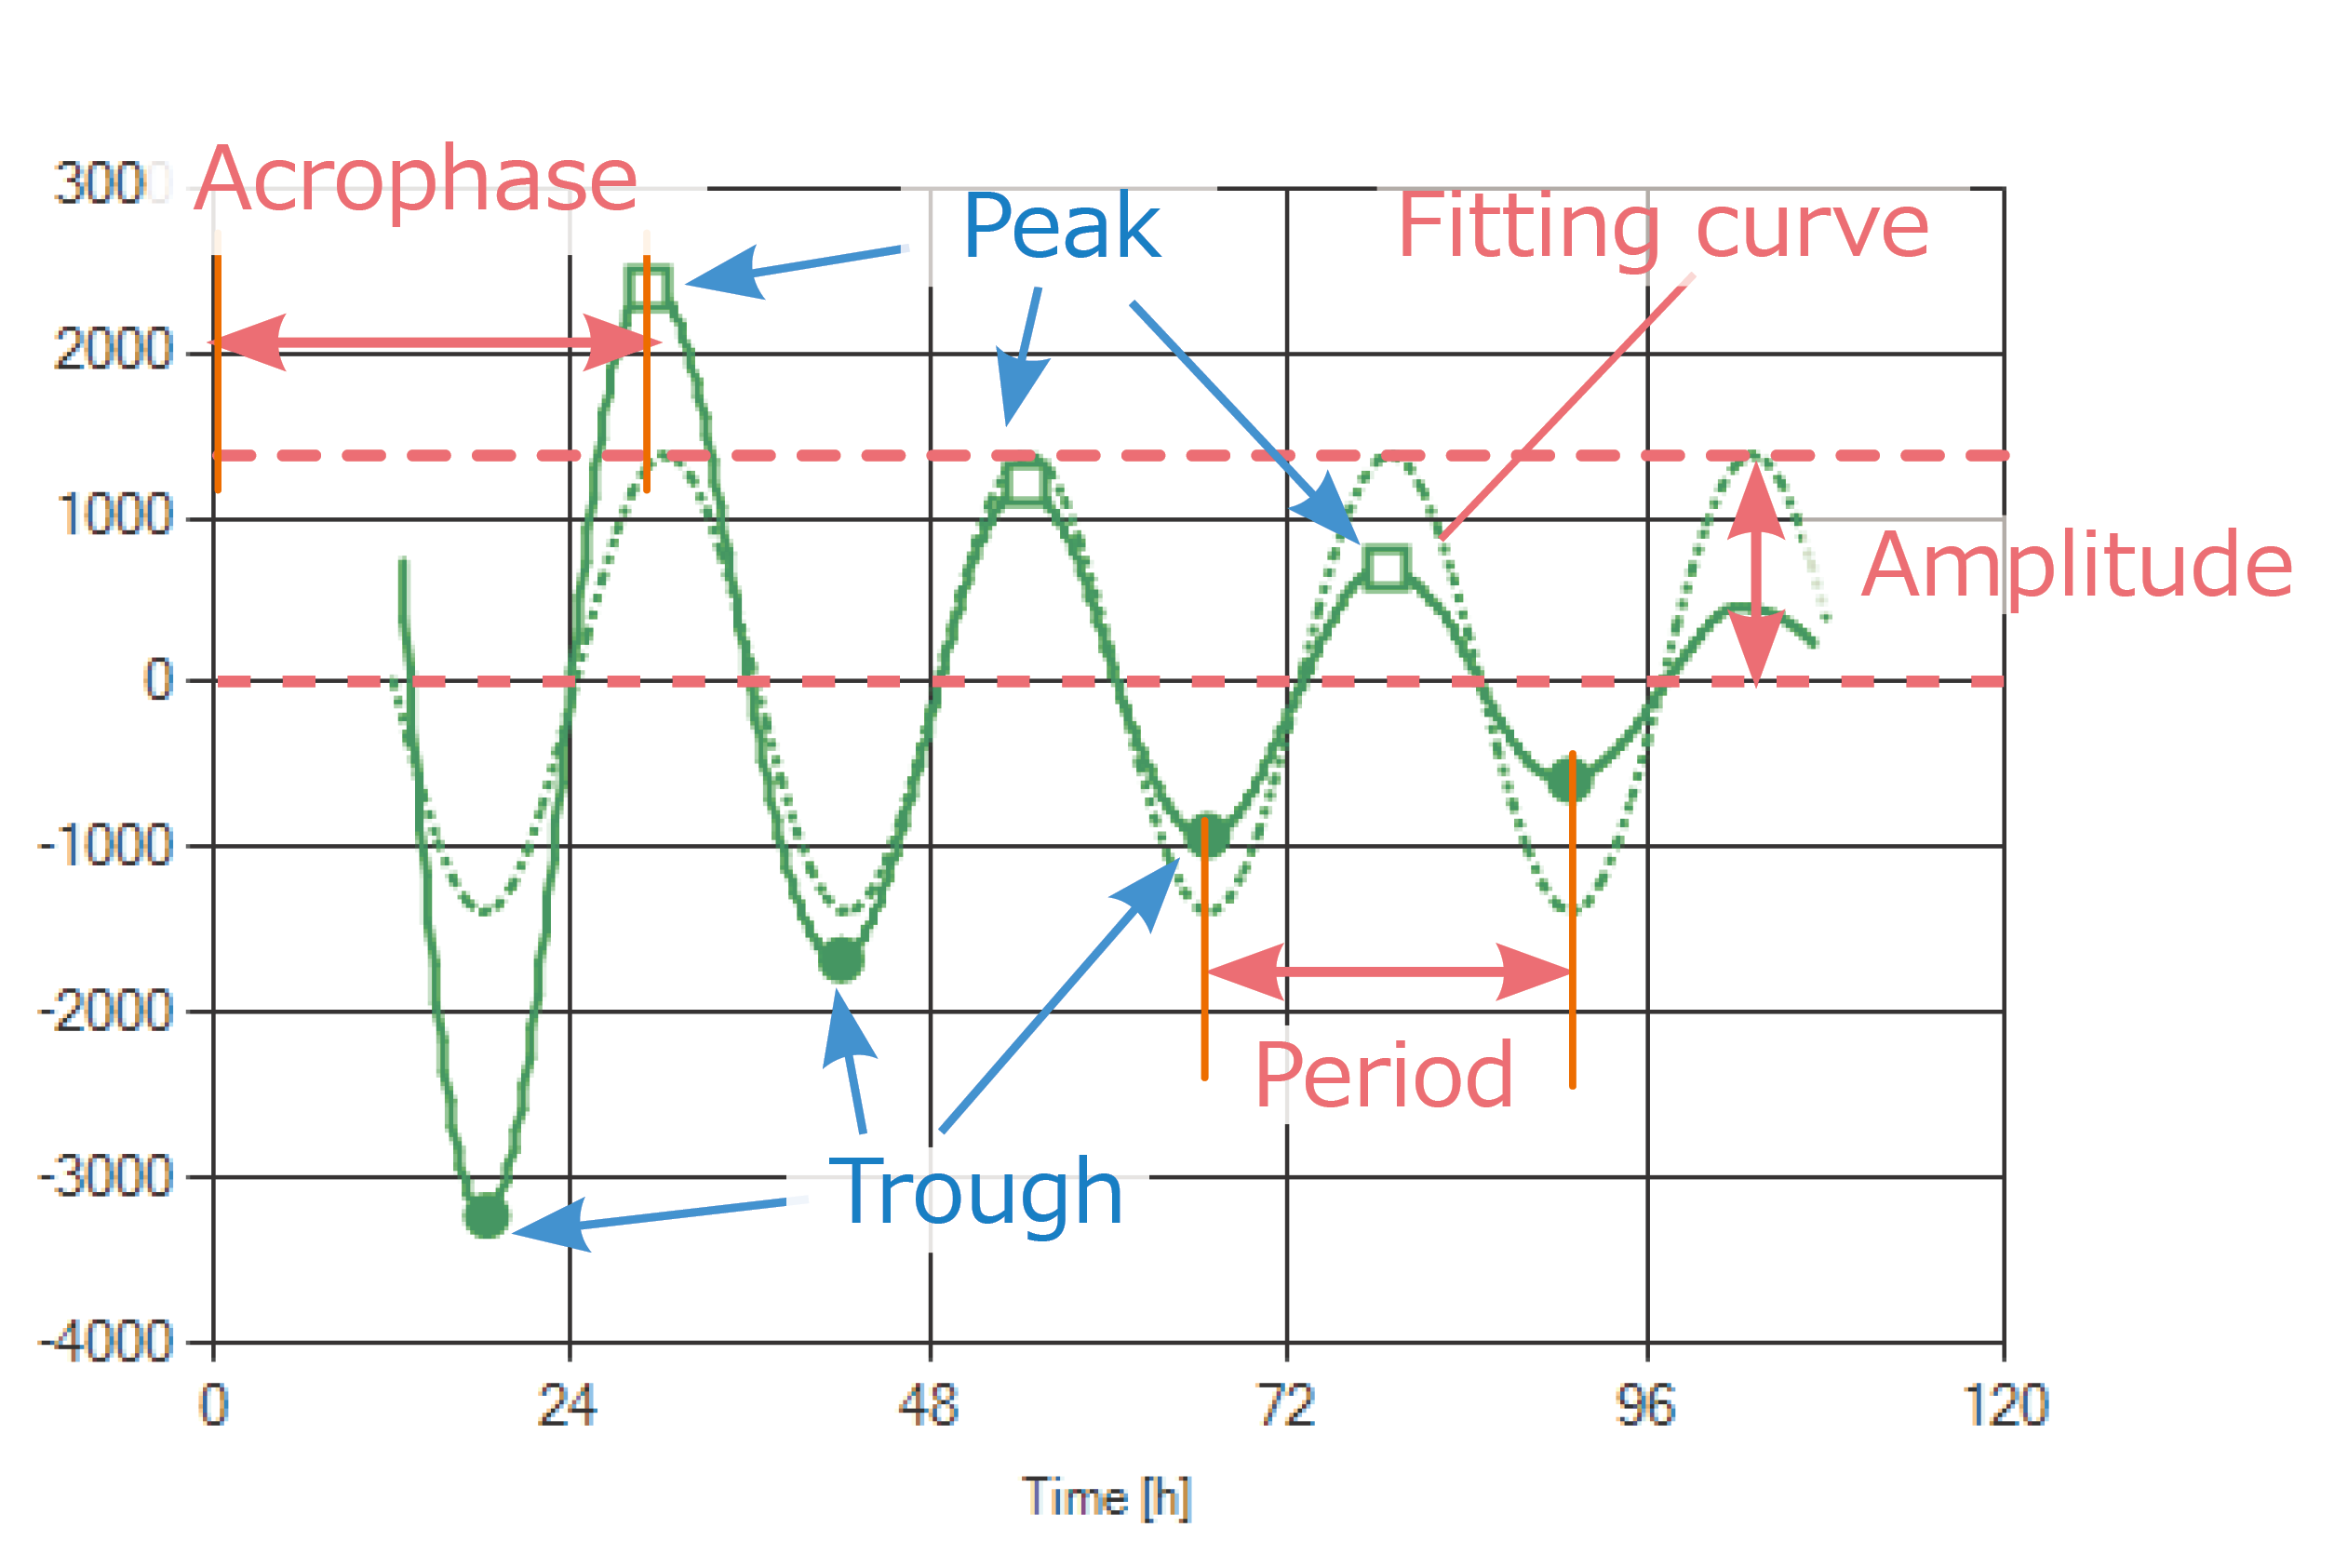
- Simple analysis results including period, acrophase, amplitude, peak/trough values
- Highly customizable settings for noise processing and detrending
- Comparative analysis possible with data from other devices or past measurements
- Clean comparative statistical analysis of large datasets using group settings
KronoAnalyzer is software that uses time-series data acquired with the Kronos series to extract peak/trough times and values, calculate period, acrophase, amplitude, as well as basic statistics such as mean, standard deviation, and coefficient of variation.
It supports not only comparisons within a single data file but also simultaneous analysis and overlay of data from up to three separate files, making it suitable for comparative analysis.
Data & Documentation
Analysis with KronoAnalyzer

Simple Analysis Results

KronoAnalyzer efficiently processes various time-series datasets, allowing simultaneous comparative analysis of multiple files and large datasets. The simplicity of the analysis results—period, acrophase, amplitude, peak/trough values—makes comparison easy and straightforward.
Group Settings & Overlay

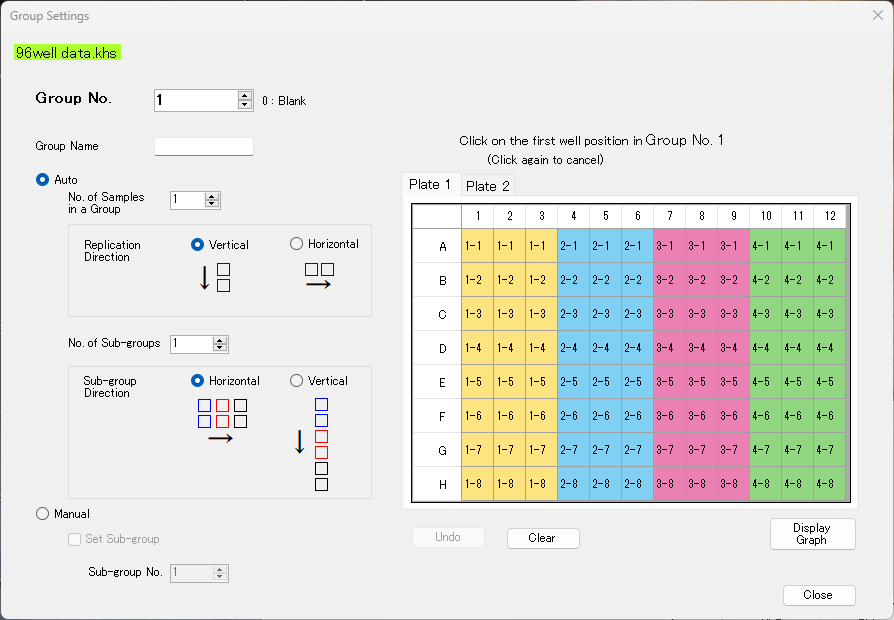
Samples can be classified under custom names by experimental conditions into Sample (n number) < Subgroup < Group. Plate layouts can be semi-automatically set simply by clicking wells.
Supports up to 192 samples (equivalent to two 96-well plates).
Once grouped, data from Kronos files or Excel files (with template support) can be overlaid and analyzed within the same file.
Brochure
Specifications
| KronoAnalyzer | |
|---|---|
| Available Data Files | · Kronos HT / Kronos Dio / Kronos files (kht / dtl format) · KronoAnalyzer files (krd format) · Excel files (with template) *Up to 3 files can be displayed, compared, and analyzed simultaneously |
| Data Display Settings | [Graph Display] · Display data of all wells (up to 3 files) · Single or parallel data display for each well (Up to 5 wells per plate; maximum: 3 files × 2 plates × 5 wells for parallel display) · Overlay data display (Up to 192 wells × 3 files) [Text Data Display] · Time-series data, Peaks/Troughs, period |
| Data Processing Settings | · Noise filtering (Moving Average / Median / Polynomial Fitting) · Detrending (Subtraction of a specified moving average) · Background subtraction (instrument-derived background) · Blank subtraction (blank well correction) · Multicolor analysis (for multi·color luminescent samples) · Peak / Trough / Period calculation · Graph XY-axis settings (X-axis: 0~999 hours, Y-axis: 0~2×10^9, Full / Auto-scale & range specification) · Data processing range setting (up to 2 intervals) |
| Group Settings | · Number of specimens (n = 1 to 192) · Subgroup configuration (Minimum: 1 well = 1 subgroup; Maximum: 192 wells = 1 subgroup) · Group configuration (Minimum: 1 well = 1 group; Maximum: 192 wells = 1 group) · Blank group setting (1 group) |
| Grouping Data Analysis | · Basic statistical analysis: mean, standard deviation, coefficient of variation · Data analysis for each group: time-series data, peak/trough, cycle · Overlay display of selected groups and subgroups |
| Analysis Data | [Peak / Trough Analysis] · Peak/Trough values and timestamps · Peak/Trough symbol display · Data sorting (ascending / descending) [Period Calculation (Cosinor Method)] · Calculation of Period, Amplitude, and Acrophase (cosinor method) · Data sorting (ascending / descending) |
| Data Saving Formats | · Analysis data: krd · Graph images: TIFF / JPEG / BMP / PNG · Data processing and analysis results: Excel / CSV |
| Language | Japanese / English (switchable within software) |
| System Requirements | Windows 10 / 11 (64-bit); Memory 8GB or higher; Display Resolution: 1920 × 1080 |
Ordering Information
| Code No. | Description | Unit |
|---|---|---|
| 3510155 | KronoAnalyzer | 1 pk |


